sustainsb.github.io

sustainsb.github.io
Scientific data-driven website and calculation repo for SustainSB.org
This proof of concept SustainSB.github.io site demonstrates an open-source approach to calculating sustainability indices for Santa Barbara, setup initially by Ben Best of EcoQuants for a SustainSB.org meeting May 4, 2017 organized by Seth Streeter, Laura Capps and Dave Fortsen. We hope to create a digital dashboard for sustainability in Santa Barbara that will become a model for cities around the world that aligns with the United Nations Sustainable Development Goal 11: Sustainable Cities and Communities.
Ocean Health Index (OHI) Framework
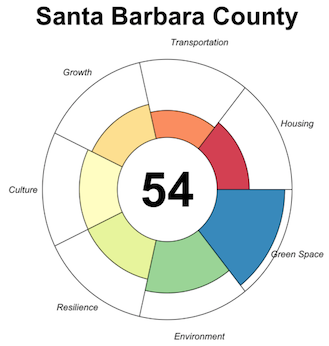
The Ocean Health Index (OHI) calculates the sustainable use of our oceans now and into the future according to a set of goals communicated visually as a flower plot and averaged into a single number for ease of comparison between regions and across years. Led by Dr. Ben Halpern at UCSB’s NCEAS, it provides a reductionist framework for potential use by SustainSB. The same open-source data science tools used by OHI are applied to this demonstration of SustainSB.
-
public website: OceanHealthIndex.org
-
science website: OHI-science.org
-
presentation: Reproducible Science with the Ocean Health Index (2014)
-
example: Gulf of Guayaqil website & files (2015)
-
app: Global OHI Explorer App (2016)
-
presentation: Transforming how we approaching marine science for management (2017)
Demo for SustainSB
This website is hosted for free on Github in a repository, a collection of versioned files:
-
website: sustainsb.github.io. This is a free public website.
-
files: github.com/sustainsb/sustainsb.github.io. This repository holds the versioned files. Anyone can download, or copy and contribute, ie fork and pull request.
Process
A typical process for arriving at sustainability indices involves these steps:
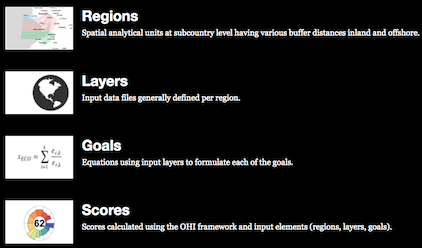
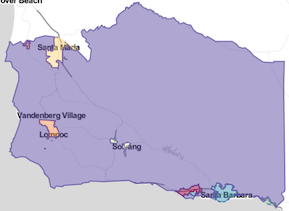
1. Prep Regions
See Prep Regions for details. Regions make up the fundamental spatial units of analysis for associating data layers and goal scores. Here’s one possibility: “regions” are the city boundaries, and the are “Outside Cities” makes up the rest of Santa Barbara County.
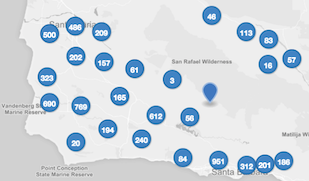
2. Prep Layers
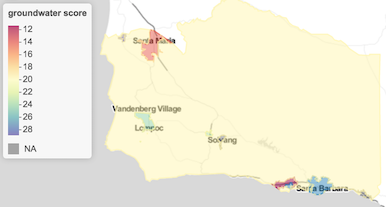
See Prep Layers for details. Any data layer should be attributed to the regions with explicit units when possible (eg km2) and can represent measurements over time. Most raw data must be aggregated or split in space and time to match the spatial regions and comparable time increments (eg years), as is the case in this example of extracting a groundwater score from the many USGS stations and sampling dates.
-
USGS groundwater stations:
-
Groundwater score summarized over regions and years as a timeseries:
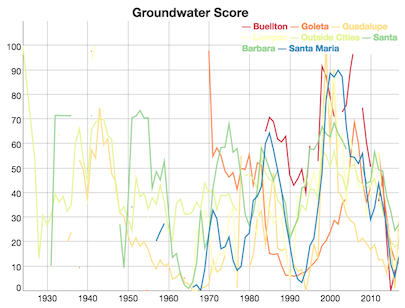
-
Groundwater score of current year (2017) as a map :
3. Calculate Scores
See Calculate Scores for details. Data layers are blended with an equation to arrive at a goal score, possibly involving dimensions (eg status, trend, pressures, resilience). The goal scores then get averaged for an index score of the individual regions. Finally, the goal and index scores for all regions are averaged with a weighting (eg population or area) to arrive at scores for the entire study area of Santa Barbara County. Here’s a mockup of goals based on the UN SDG11 targets and fake data.
Technology
The open-source approach demonstrated here is interoperable with other technologies such as ESRI commercial software (desktop, server and web services) that SustainSB technology lead Mike Wald of Oniracom is exploring.
For more on the specific stack of open-source software (R programming language, RStudio integrated development environment, Git versioning program, and GitHub collaborative development portal), please see the OHI Manual:
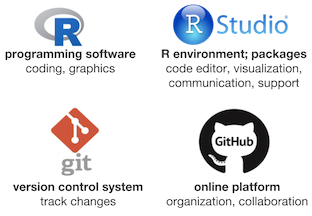
This software stack can operate across platforms (Windows, Mac, Linux) for free, which lowers the barriers to entry for other individuals to contribute to SustainSB or other cities to adopt the framework.
It is especially useful to differentiate applicable technology to the various processes along the life stages of data:
Curating Data Catalogs
-
ESRI offers many data layers for consumption as web services via arcgis.com, which can be aggregated into data portals such as LA GeoHub.
-
The Santa Barbara Atlas of the SB Conservation Blueprint, which is led by the Conservation Biology Institute (CBI), has organized hundreds of relevant layers into a single portal, the continued curation of which would greatly benefit SustainSB.
-
Many free data portals, such as data.gov and data.ca.gov, offer additional spatial data for consumption.
Consuming Data
- Application programming interfaces (APIs), such as OGC spatial web services or the USGS REST Web Services used in the prep_layers example, enable automated consumption of data, whether using ESRI or open-source software.
Calculating Scores
-
ESRI offers Model Builder, a scientific workflow, for both desktop and online server software.
-
CBI offers Environmental Evaluation Modeling System (EEMS; eemsonline.org) as an online platform for combining data layers with simple logic (addition, multiplication).
-
Open-source data science programming languages such as R or Python offer the most flexibility for consuming data and creating arbitrary calculations.
Presenting Results
-
A website can be published for free using Github Pages.
-
This web hosting can also apply to a registered for a domain. For instance sustainsb.github.io could be sustainsb.org and based on files at github.com/sustainsb/sustainsb.github.io, similar to how ohi-science.github.io redirects to ohi-science.org that isbased on files at github.com/ohi-science/ohi-science.github.io.
-
This free web hosting is only available for static web files (html, js, css, …) and not for server-side processing such as a WordPress site. The user experience can still be interactive, using Javascript, and site pre-processed with templates (eg using blogdown).
-
The interactive mapping readily available with open-source software (eg leaflet) can show spatial data, but lacks the polish and responsiveness of the ESRI products.
Automatically Update Data, Scores and Results
Fetching the latest data from the USGS REST Web Services or other similar web services for various data layers is possible at monthly/weekly/daily frequencies, along with recalculation of SustainSB goal and index scores for free! (The geek speak of how this is possible is using a cron job to continuously integrate on a Github repository using Travis CI service that spins up a server to check code and can be appropriated to fetch data, prep layers, calculate scores and update the website.)
2017-06-11: Auto-Update Working!
This free daily calculation infrastructure has now been setup for SustainSB (eg see travis-ci.org/SustainSB/sustainsb.github.io and issue #2 for details). Note the badge at the top of this page which describes the build status:
Now you can see the Travis builds resulting from either regular push (from git commit and push operations) or cron (daily execution of code without need for git commit and push) events in the SustainSB/sustainsb.github.io commit log:

Gathering Feedback
-
Similar to SeaSketch, the CBI DataBasin platform offers spatial commenting, allowing you to participate in a thread of conversation and associate comments with spatially drawn features (eg point, line or polygon) and map (with specific layers turned on and extent captured).
-
Google Forms are free and easy for non-spatial feedback.
Contact
Please feel free to direct questions or suggestions about this repo to Ben Best (ben@ecoquants.com), who can also add you as a member to the SustainSB Github group (github.com/sustainsb) given your Github login (easy to register at github.com).